
One of the hardest parts of working for a startup is making every penny count. What’s the best way to ensure you’re being cost-effective and generating the right leads? Well, throw a digital strategy against the wall and see what sticks, obviously.

KIDDING. If that were the method, this would be a very short article. The right answer is: metrics. Being able to gather meaningful metrics and understand the picture they’re painting is one of the most valuable skills a marketer can have – especially one who’s fighting the endless “do more with less” battle.
So, let’s hop into some startup marketing metrics that early-stage companies care about, and I’ll pepper in some tools that can help you along the way. This is nowhere near the entire spectrum of things you CAN track, and definitely not the most sophisticated models (check out marketing attribution models if you’re looking for some really fancy stuff), but it’s a good baseline.
All about that stack
Because, well, we’re MarketingTechStack and that’s what we love. When I first introduced martech at my current startup (SaaS tech platform), I started with this:
- CMS: WordPress
- Web analytics: Google Analytics
- Email marketing: ActiveCampaign
- CRM: Zoho
- Support/chat: none
- Marketing automation: we kind of stuck things together with gum and paste to make our small systems act like they were automated, but it wasn’t true marketing automation
A few years later, after some funding and a growing sales team, I still use the same types of tools, but I’ve upgraded my marketing automation suite and CRM to HubSpot.
In this article, I’ll focus on Google Analytics as the main platform for web analytics, because it’s free and arguably the most advanced. However, some marketing automation platforms have their own web analytics features. If you prefer to use that, you do you, boo.
Web analytics: How are people finding you?
You can glean a lot from web analytic data. But if your site is brand new, you’re not going to have a ton of traffic in the beginning to learn from, so you’re facing a lot of testing in the early stages.
Side note: Google has released G4 properties, which is the default for newly-created properties. While I might use terms from Universal Analytics, what you want to track remains the same, it’s just that where you find it may be slightly different between G4 and Universal Analytics properties.
Google Analytics provides a TON of data; it’s easy to get buried. The most basic questions you’re trying to answer are:
- How many people am I attracting to my site, and is it increasing on a weekly, monthly, quarterly or yearly basis? (number of visitors)
- What pages are people most interested in? (page views)
- What pages are people abandoning way too quickly? (bounce rate)
- What sources are driving the most people to our site? (UTM parameters)
PS: If you’re an ecommerce company, you’ll also want to look at things like cart abandonment and product interest. This is a pretty good guide to setting up goals specific to ecommerce.
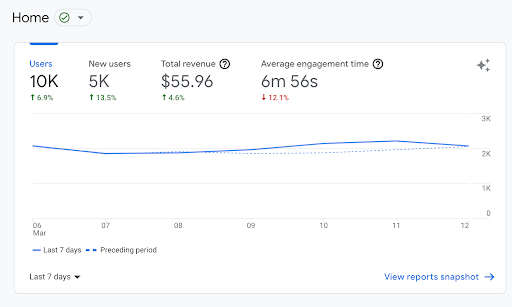
The home screen gives you a nice overview of how many people are coming to your site. If you haven’t customized this, then by default, it will show you:
- Users: The number of visitors who have come to your site in a given time period.
- New Users: The number of NEW users who have come to your site in a given time period (removing repeat traffic).
- Average Engagement: The average time spent by active users in a given time period.
- Total Revenue: The sum of revenue from purchases, subscriptions & advertising.
- This metric is very ecommerce-driven and requires additional setup. Google gives a good overview here: https://support.google.com/analytics/answer/9786881?hl=en
Weee will, we will…rock UTM parameters
Okay, so those metrics are what you need to know for site traffic and engagement. However, if you’re the savvy marketer we know you are, you’ll want to know how visitors are getting to your site. Which campaigns and channels are the most impactful? For that, we use UTM Parameters.
Fun fact that I found out while writing this article: UTM stands for Urchin Tracking Module. Urchin was the predecessor to the Google Analytics we all know and love. So, put that in your pocket for your next marketing trivia night. That’s a thing, right?
Anyway, back to UTM. UTMs are six dynamic parameters you can attach to the end of a URL that allow you to track where traffic is coming from:
- Campaign ID
- Source
- Medium
- Campaign Name
- Content
- Term
You don’t have to use all six, and I don’t. I think the most useful ones are:
- Source: The referrer (e.g., Google, newsletter)
- Medium: Marketing medium (e.g., cpc, banner, email)
- Campaign Name: Short name to identify your campaign
You can use this helpful URL builder to create your links: https://ga-dev-tools.web.app/campaign-url-builder/
This little trick gives you insight into where users and sessions are coming from so you can double-down or pull back on certain campaigns. The hardest part of UTM parameters is keeping them consistent (Google is case-sensitive, so Email and email will show as two different mediums, be warned). Also, just remembering to use them consistently in your campaigns can be tough.
My suggestion is to create a list of values that can/should be used in each parameter, document it, and maybe even go so far as to create a spreadsheet that generates the link for you, like this one.
Now, to lead generation
As a business looking to make sales (you are, right?), your biggest questions will be. “how many leads am I generating, what’s the quality, and at what cost?”. From there, you’ll want to know which sources are giving you leads that actually convert into customers.
How many leads do you need?
This can be a tough question to answer, especially if you’re a relatively new startup without an established funnel. The best path is to work closely with sales leadership to understand the sales cycle and revenue goals: length and stages of the sales cycle, and how many closed deals it takes to reach revenue targets.
If you don’t have the benefit of historical data, do your best to estimate conversion rates, and go from there. For example, when we did this exercise at my current startup, we started with a revenue goal and established an expected average deal size, which gave us the number of deals we needed to close to meet those goals.
I worked backwards from there, using our sales stages as my conversion points. I ended up with a funnel that looked roughly like this (numbers are not actuals because, well, boundaries and all…).
- Revenue goal: $100,000
- Average deal size: $25,000
- Deals needed: 4
Using the sales cycle, I was able to create this funnel as my estimate:
- Leads: 213
- % convert to meeting: 20%
- Expected meetings: 43
- % meetings agree to pilot: 25%
- Expected pilots: 11
- % agree to active pilot: 75%
- Expected active pilots: 8
- % move to closed deal: 50%
- Expected deals: 4
Once I knew the number of leads needed, I could focus on which activities would give me the most effective leads to hit, or exceed, my estimated conversion rates.
Lead source?
And that brings us to source tracking. There are a lot of opinions out there on how attribution should work for marketing leads, but I’m going to keep things simple. At the very least, it’s important to track the original source so you can decide if you should double-down on events or focus on digital ads.
How do you know if a channel is successful or not? I invite you to scroll up and look at the sales funnel again. Then determine which sources are helping you meet or exceed your conversion rates.
Also, because I have strong opinions on this, I suggest using at least two source fields:
- Lead source: This is a high-level roll up that groups your leads into general buckets like Events, Paid Social, Paid Digital, Email, etc.
- Lead source detail: You guessed it, this gives more detail on the source. So, where lead source might be “Event”, lead source detail could be, “Rodeo clown convention 2022” (Hey, I’m not judging…I assume you were there for a legitimate purpose).
Keep track of lead source throughout the funnel. This will help when you go to set your marketing strategy.
Cost per lead (CPL)
And speaking of budget, don’t forget to track the cost per lead for each source. While a lead that buys is great, if that lead costs $100 to generate and they’re buying a $5 widget, you’re going to want to abandon the campaign. While it’s true that CPL can be high in the beginning of a campaign, you should have a target to stay under, and ensure your average CPL is within the range. Otherwise, you’re outspending your revenue.
CPL can also be a good reality check when comparing the effectiveness of campaigns. Take campaign A: a digital ad that has spent $1,000 to date, and generated five leads. Compare to campaign B: a webinar that costs $5,000 but generated one hundred leads.
While $1,000 is less than $5,000, the CPL on that campaign is actually 4X of B, meaning it’s a less effective campaign. BUt you can’t really declare campaign B the winner yet – for that, you have to go back to the sales pipeline and see what has converted to actual dollars. Still, CPL does give a better view than looking only at spend.
Funnel: MQL vs SQL
As a marketer, you know the term “lead” can be all-encompassing – it could mean anything from names in a database to legitimately engaged contacts. How do you tell the difference? One way is to set up definitions for a Marketing Qualified Lead (MQL) vs. a Sales Qualified Lead (SQL).
Once again, sales leadership will be your best friend with this one. Work with them to establish the profile for an SQL (warning: this will take a few iterations), then build lead scoring to move leads from an unqualified name in a database to an MQL and eventually to an SQL.
You’ll also want to track velocity (how quickly or slowly people are moving through the funnel) and conversion rate on SQLs. Are you sending fifty SQLs a month but the sales team is only getting a 10% conversion to meetings? Your qualification process needs some tweaking.
Be warned: this part can get frustrating, but it is meant to be a learning process, and it’s really valuable once you get it right.
PR/Brand
PR & brand awareness can be one of the toughest marketing metrics to track. Depending on your product and industry (and budget), hiring a good PR agency might be a great idea. But to get you started in the meantime, here are the metrics that PR can impact:
- Website traffic: Keep an eye on organic web traffic. Have you seen a spike since running some PR efforts? While you can’t attribute it 100% to PR, you will likely see a jump in organic traffic shortly after a press release or key article placement.
- Backlinks/referrals: Similar to organic traffic, you can use Google Analytics to see how many sites are linking back to yours. While this is often the work of an SEO strategy called backlinking, it can also be from your PR team placing articles that link to your pages.
- Brand mentions: This might be a little hit or miss. Some tools, like SEMRush, offer brand tracking across the web and social media. Other options are to use a social media tool to track mentions of your brand (tools like HubSpot and HootSuite offer this), or if budget is a concern, you can set up a Google Alert to let you know when your company name is indexed anywhere online.
As I mentioned, this list is far from exhaustive, as there is a lot that can and should be tracked. However, I hope this gives you a starting place. As always, my startup friends, take a deep breath, pour a glass of wine, and remember that marketing is fun (okay, maybe not always, but a lot of the time it’s kinda fun…right?).


